 |
New method of kinetic energy evaluation |
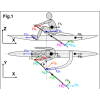
A new method of kinetic energy evaluation was recently developed, which is quite simple and requires only the boat velocity, oar angle and seat position data. It was found that about two thirds of the drag energy is spent during the recovery, and only one third during the drive. the new method produces quite reasonable values for kinetic energy, even without force measurements. |
05/05/2019 |
View |
 |
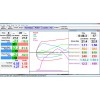
Erg Testing With The BioRowTech System |
A look at how the BioRowTech system can be used in conjunction with erg testing to identify technical problems and improve them. |
19/04/2019 |
View |
 |
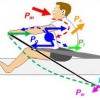
Balance of Propulsive Forces |
An continued analysis of forces in rowing, discussing the balance of propulsive forces on the boat hull and how they relate to internal forces. |
22/03/2019 |
View |
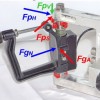 |
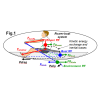
Balance of forces on the boat hull |
Experiments with comprehensive force measurements were conducted recently with new the BioRow instrumented C-bracket mounted on a wing rigger. For the first time, the drag force on the boat was determined directly with BioRow measurements, which can be used for evaluation of rowing technique and equipment quality. |
23/02/2019 |
View |
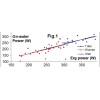 |
Erg Power vs. On-Water Power |
An insight into how rowing power in a boat is related to the erg scores of the rower |
07/01/2019 |
View |
 |
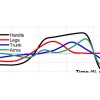
Power And Kinetic Energy In Rowing |
A continuation of our discussion of power measurement in rowing. |
26/12/2018 |
View |
 |
Discussion on Power in Rowing |
Recently, there have been discussions relating to power in rowing. A response to my Newsletter from 2018/09 can be found here:
http://www.rowingscience.nl/optimizing-propulsion/power-in-rowing-response-to-the-kleshnevs-october-2018-newsletter/
Please see the discussion so far in it's entirety - (text in black after < mark is the citation from the response of our respected opponents, text in blue after VK: mark – is my text).
|
25/11/2018 |
View |
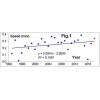 |
An analysis of the results of the 2018 World Rowing Championships |
In this newsletter we will analyse the trends and interesting characteristics of the successful crews at this year's World Championships in Plovdiv. |
15/11/2018 |
View |
 |
Handle Force Measurements with the BioRowTech erg system |
You can now measure handle force on the ergometer with the BioRowTech system. |
07/11/2018 |
View |
 |
Rowing Power |
Several scientific articles about rowing power were recently published, which placed doubts upon the standard definitions of this important indicator of performance. The power created between the pin and the oar handle can be called the “Net power”, which is transferred through the oar shaft to the spoon, so this is the only source of energy which moves the rower-boat system forward. Net power transferred from a rower to the external environment is the most important indicator for the evaluation of a rower’s performance. It is measured correctly and reliably with BioRowTel and NK EmPower systems. |
05/10/2018 |
View |


