


Rigging optimization for rowing efficiency
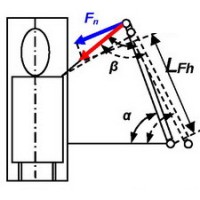
An interesting case occurred during our recent BioRow testing: a female single sculler (1.56m, 65kg) performed the standard BioRow step-test protocol (RBN 2013/04). Originally, the rigging was 0.88/2.85/1.60m (inboard/ oar length/ span), which made the static oar gearing ratio 2.077 very light even for this LW1x rowers’ category (RBN 2020/07). Effect of light static oar gearing was multiplied by light dynamic gearing caused by short catch angles (about 53deg at low rates, down to 49deg at racing rate), which was related to long inboard and span at quite short athlete’s height. This made overall gearing too light, which was confirmed with “burden factors: both HDF (63-65 kg/m) and mass equivalent ME (37-39 kg over cycle) were much lower the average values for this category. The sculler had no problems with maintaining high racing stroke rate 35-36 spm, but struggled to “connect” with water and apply power: strokes looked too light and unproductive, speed target was not achieved.
After the data analysis, it was decided to change the rigging by means of shortening oar levers and span down to 0.865/ 2.84/ 1.58 m, which made the static oar gearing 2.1% heavier up to 2.121, and also the stretcher was moved 4 cm aft (to the stern), which supposed to make catch angles longer and dynamic gearing heavier. It is important to note combined changes of both levers and stretcher position, which helped to maintain a comfortable finish position: if only levers would be shortened, the handles would be too far from rower’s body, if only the stretched moved aft – it would be too “tight” at the finish.
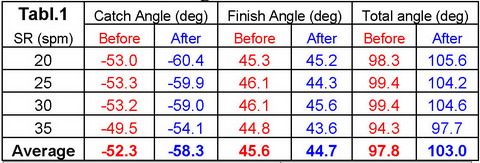
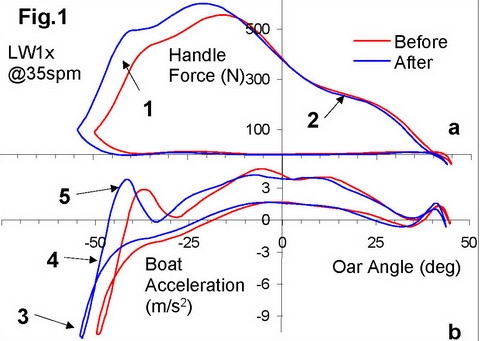
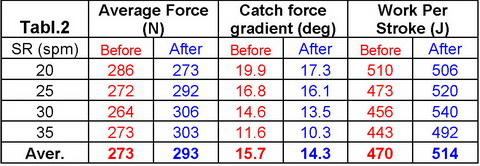
The testing was repeated with new rigging settings, and catch angles were found 5-7deg longer (Table 1), while finish angles became only about 1deg shorter, so the total stroke length increased by 4-7deg. Force production increased during the first half of the drive (Fig.1,1), while remained nearly unchanged during the second half (2). The negative peak of boat acceleration became deeper (3), and the most important, the gradient of acceleration became much steeper (4) as well as the first positive peak higher (5), which means the “trampoline effect” became more significant (RBN 2008/07). The average force increased by 11% at racing stroke rate (Table 2), the catch force gradient became 1.4 deg shorter and WpS increased by 11-12%.
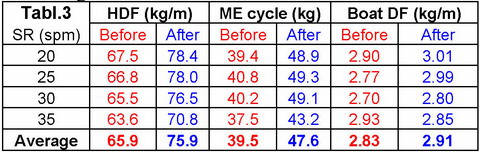
Rigging changes made rowing “burden factors” heavier (Table.3): HDF increased by 15% on average, and Mass Equivalent ME over the cycle by 20%, from 39.5 up to 47.6 kg, which means the rower “pulled” about 8kg heavier load.
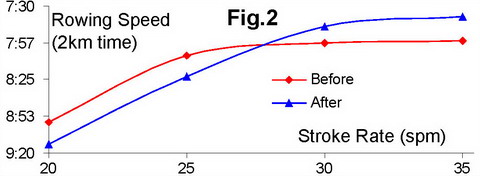
The weather conditions were slightly slower during the second testing after rigging changes, which is indicated by 3% higher boat Drag Factor DF above. Rowing speed at lower rates 20-25 spm slightly decreased during the second testing (Fig.2), which could be explained by higher headwind and lower force application. However, at racing rates 30-35 spm, the rowing speed significantly increased and projected time over 2km was 12.5 and 18.7s faster after rigging changes.
This case is another evidence on how an optimal oar and boat rigging may help to improve rowing efficiency and speed. Of course, the real result would depend on how the athlete will be able to sustain the increased load caused by heavier gearing during full race distance, which depends on physiological conditions of this sculler. However, this biomechanical analysis objectively shows that, at least, the optimized rigging significantly improved ability to apply force and power at shorter distances.
©2022 Dr. Valery Kleshnev www.biorow.com