


Analysis of Tokyo Olympics results
A strong cross-tail wind allowed for quick times on Tokyo’s Sea Forest Waterway, despite fairly rough water. Six World best times were set (W8+ ROU, W2- NZL, LW2x ITA, LM2x IRL, W4x CHN in FA, M4x NED in FA), all on Wednesday 28th July. This made it the second fastest World regatta since 1993, only 0.3% slower than Worlds-2014 (Amsterdam) (Fig.1, the average speed in 13 consistent Olympic boats).
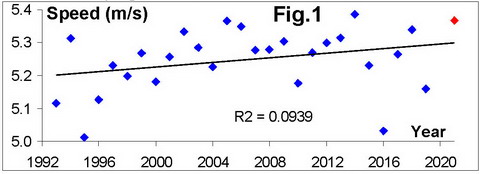
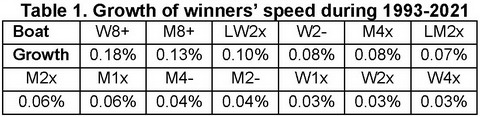
The linear trend during 1993-2021 grows by 0.065 %/year (0.0035 ms-1/y). W8+ continues to show the highest speed increase (0.18%/y), significantly higher than in the next M8+ (0.13%/y) and LW2x (0.10%/y). The lowest trend (Table 1) was found in women sculling boats (0.03%/y).
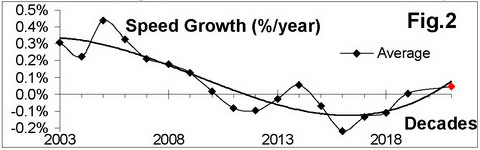
More detailed analysis in scrolling decades (RBN 2020/08) also shows continuous growth during the last two decades (Fig.2) with the latest value +0.045 %/y.
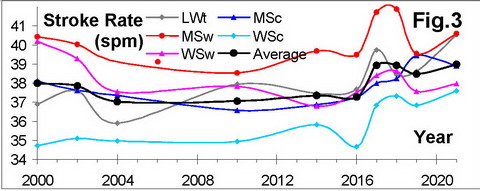
The average stroke rate in the 12 Olympic boat types (Table 2) was 39.0spm, which is 0.6spm higher than in the previous Worlds-2019 in Linz and similar to Worlds-2018 in Plovdiv. This is possibly weather-related: faster speed allows for a higher stroke rate.
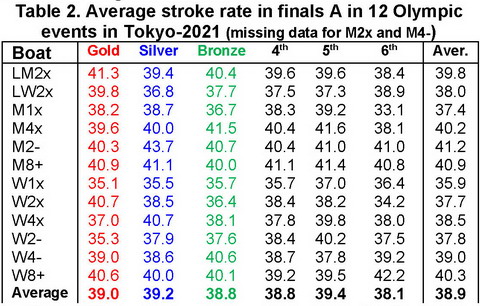
The differences in the rate between finalists were insignificant: only ±0.2spm within the first four place-takers, though 8 out of 12 winners showed lower average stroke rate than their silver competitors.
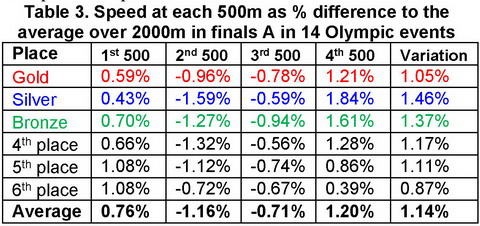
Radical changes were observed in the race strategy, which is now much more even. Two years ago in Linz the average variation of 500m splits in A finals was 2.56% (+3.5%, -1.6%, -2.1%, +0.3%), but now (Tab.3) it is more than two times lower 1.14% (+0.8%,-1.2%,-0.7%,+1.2%). The first 500m split was the fastest in all previous regattas, but now the last section is the fastest. As before, the winners had the most even distribution of efforts during the race (Tab.3), except the 6th place-takers.
Analysing the absolute splits (Tab.4), the winners were faster than other finalists at each section, except the last 500m, where silver medallists were 0.19s faster. As before, the main advantage was taken by the winners at the second 500m, where they were about 1.0s faster than their closest competitors.
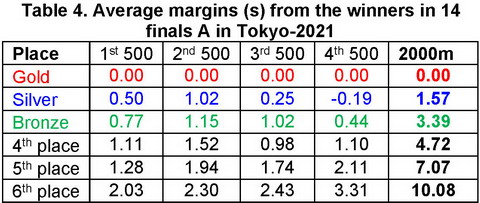
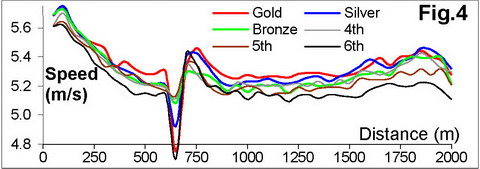
Fig.4 confirms the above conclusion with average data (12 boats) at each 50m section taken from GPS (the glitch at 650m appears to be the shielding of the GPS signal by the bridge). The winners were among the slowest at the first 100-150m after start, but significantly faster than their competitors during the middle of the race.
©2021 Dr. Valery Kleshnev www.biorow.com