Standardizing of biomechanical data

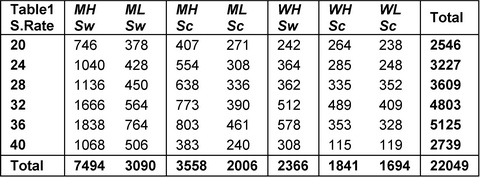
In the previous newsletter, it was found that BioRow data could be used for standardizing of the measurements of the EmPower instrumented oarlock. To do so, a database containing more than 22,000 samples collected with the BioRowTel system during the last eight years was analysed. Athletes were grouped into seven categories depending on their gender (Men/Women), weight (Heavy/Lightweights) and type of rowing (Sweep/Sculling). In each category, the stroke rate was rounded to the closest number divisible by 4 and samples were grouped into six stroke rate categories from 20 to 40 spm. Table 1 shows the number of samples analysed in each category:
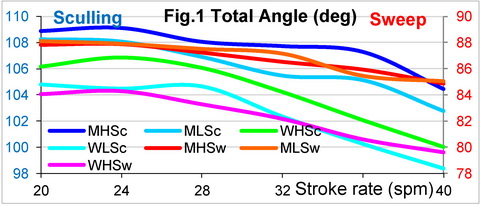
Dependence on the stroke rate was quite different in the variables. The stroke length (Total Angle) was consistent at rates from 20 to 28 spm, but at rates 36-40, it decreased by 3-4 deg in sweep rowing and by 5-6 deg in sculling (Fig.1). This happened by means of proportional decreasing of the catch (by 2-4 deg) and finish (by 1-2 deg) angles. It is interesting that the stroke length was practically the same in both men’s sweep categories: Heavy- and Lightweights, but in sculling groups (both men and women), Lightweights had about 2deg shorter stroke length.
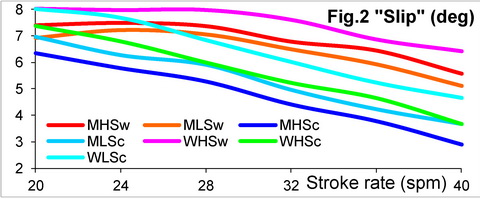
Catch “slip” significantly decreases at higher rates in all sculling categories (Fig.2): at 40 spm it was about two times shorter than at 20 spm. In sweep categories, “slip” was quite consistent at rates 20-30 spm, it then decreased by 2 deg at 40 spm.
Contrarily, the “wash” at the finish was very similar in sweep and sculling groups, but it depends on the rower’s gender: in male categories it was 5-6 deg shorter. This could be explained by stronger arms in males, which allows longer force maintenance at the finish. “Wash” gets about 2deg longer at higher rates (Fig.3), achieves its maximum at 32-36 spm, but then decreases by about 1 deg at 40. For evaluation of EmPower data, “Wash” values must be multiplied by 0.77, as it was found before (RBN 2017/03).

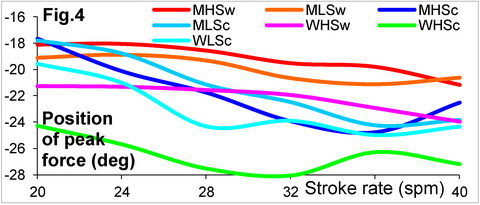
The position of the peak force was quite similar in all categories, except women’s sculling (Fig.4), where it was achieved about 4 deg earlier. At higher rates, the peak force is achieved about 3 deg earlier after the catch.
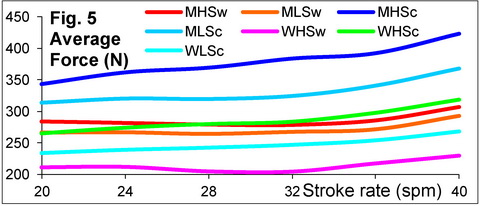
Both average and maximal forces increase with stroke rate (Fig.5), more significantly in sculling (2-3 N/spm) than in rowing (0.8-1 N/spm). This factor compensates decreasing of the stroke length, so Work per Stroke remains quite constant across various stroke rates. Therefore, WpS could be reliably used for a rower’s evaluation.
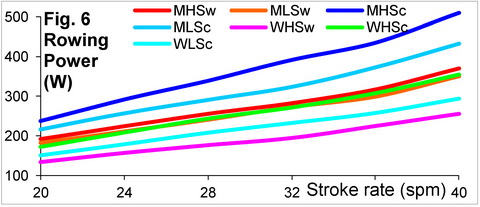
Power grows with the stroke rate (Fig.6) with the average gradient 8.8 W/spm, which varies from 6.0 in WHSw to 13.2 W/spm in MHSc categories.
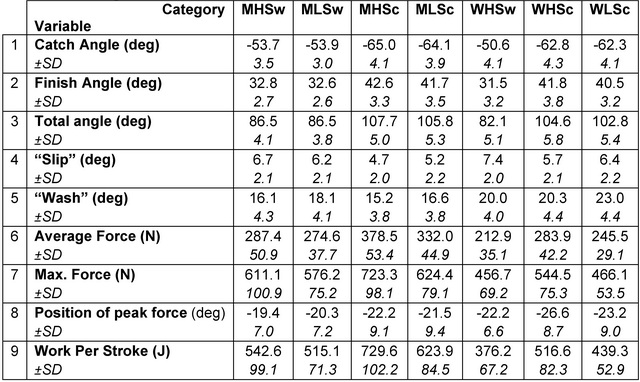
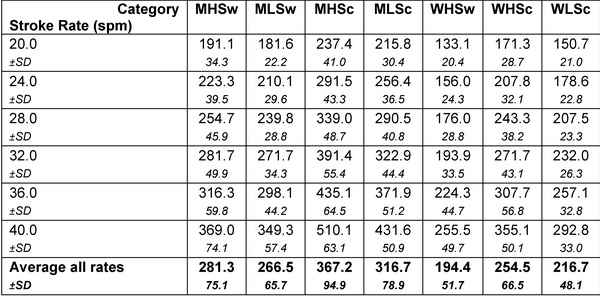
Tables 2 and 3 in the appendix below show the average values of the main biomechanical variables (for all stroke rates) in each category and their standard deviations, which could be used for standardizing of rower’s performance. The most of data was collected in 2km step test (RBN 2013/03), so for shorter pieces, force and power would be higher, for longer distances - lower. Normative values for various distances could be obtained using speed/distance equations (RBN 2012/1).
©2017 Dr. Valery Kleshnev www.biorow.com
Appendix to Rowing Biomechanics Newsletter 2017/04
Table 2. Average values of the main biomechanical values in rowers’ categories