


New analysis method of biomechanical curves
Do you know that female scullers exhibited the most "front-loaded" force curve, followed by male scullers. Sweep rowers, on the other hand, displayed slower catch force gradients. In the second half of the drive, male scullers demonstrated superior force maintenance, while female sweep rowers experienced an earlier drop, possibly indicating differences in upper body muscle strength among the categories.
The size of sculling boats had virtually no impact on the shape of the force curve, as observed in singles, doubles, and quads. Comparatively, scullers exhibited a much "fatter" force curve than sweep rowers. In eights, sweep rowers displayed the slowest catch force gradient and the earliest force drop during the second half.
An increase in stroke rate results in a more "front-loaded" force curve. However, during the second half of the drive, the force decreases earlier at higher rates due to the higher handle velocity.
These and other findings has been revealed with recently developed new BioRow analysis method, which introduces greater objectivity and enhances feedback for rowers and coaches.
Patterns (curves) of various biomechanical variables are widely used for technique analysis and feedback in rowing biomechanics. The most famous one is the "force curve," which defines the distribution of a rower's efforts during the drive phase and is commonly referenced in rowers' and coaches' conversations. In BioRow data analysis, we compare curves from various rowers or from a single rower at different stroke rates, and retrospectively evaluating performance during previous testing. Additionally, comparing these curves with "target" curves helps assess the rower's technique and determine the direction for improvement. The current method of deriving target curves is based on data from the world's best rowers and biomechanical modelling. However, it is still somewhat subjective: the target force curve is manually constructed around only three points defined using objective statistical data—the position of peak force, catch, and finish gradients (RBN 2018/03).
The latest part of BioRow database over 12 years (more than 50k rower-samples) has been reprocessed using the new method.
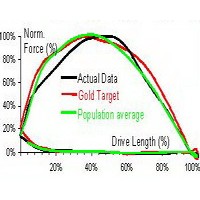
By adopting this new BioRow method, we evaluate only the shapes of curves for various variables, while their magnitudes are analyzed separately using their maximal and minimal values. It has already been implemented in testing reports, allowing for a comparison with population averages not only for numerical values (RBN 2021/04) but also for curves of the main variables. On the updated Evaluation pages of the reports, where the measured actual force curve was previously compared with the "Gold Target" (which has also been adjusted), an additional curve, "Population Average," has been introduced.
This new method enables the analysis of typical patterns for other major variables such as handle and seat velocities, blade work, etc., potentially leading to interesting discoveries. Moreover, it allows for a more precise derivation of target curves, providing rowers and coaches with improved tools to evaluate rowing technique, enhance effectiveness, and achieve better results.
This is a short version of this Newsletter. Full text is available for BioRow members: https://biorow.com/membership/
©2023 Dr. Valery Kleshnev