
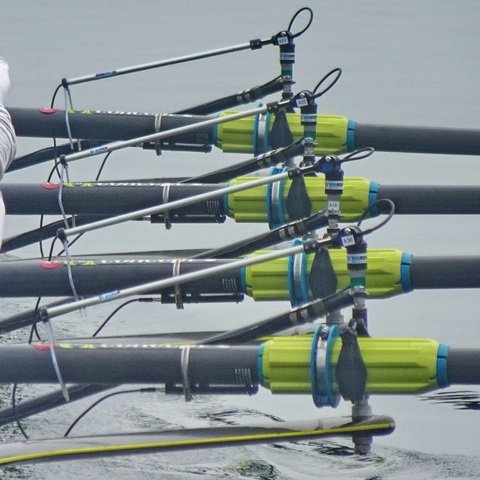
Did you know that 85% of the variation in work per stroke was explained by variation in force and only 15% by variation in stroke length. Thus, the contribution of force was 5.7 times greater than that of stroke length?
With the current development of rowing electronics, biomechanical measurements have become increasingly popular. As a result, very common questions from our audience are: “What is the target value of force and power for a junior men’s single?” or “Please give me the optimal oar angles for a women’s four?” The available information on target characteristics appears to be rather subjective. Usually, data from a single outstanding athlete or crew are used, and all other rowers are expected to “fit” those targets, which is practically impossible. Over time, new champions emerge and the “gold standards” have to be revised, which undermines confidence in them and reduces the effectiveness of training. Therefore, the purpose of this study was to develop an objective method for obtaining target characteristics for rowers of different ages and performance levels.
In the exact sciences, target characteristics are calculated using object modelling methods. For example, by specifying a car’s maximum speed, one can determine the required engine power and subsequently the torque, rpm, the compression ratio, fuel consumption, etc. However, for biological systems such as athletes, this approach is not applicable because individuals differ in their characteristics (height, body mass, etc.) and training background.
In most biological sciences, statistical methods are typically used to determine such “normative characteristics”. For example, in medical diagnostics, mean values and variation are determined for groups of patients with a particular disease and for healthy individuals, after which normal ranges are established that indicate the absence of disease. However, this approach is also not applicable in elite sport, since it is practically impossible to measure all winners of World regattas to determine their biomechanical characteristics.
Therefore, a combination of the two approaches described above was used to derive the target biomechanical characteristics:
Analysis of rowing speed based on world-record data for each rowing category showed that, on average, the speed of U23 rowers was 2.5% lower than that of Olympic-level athletes, while for U19 rowers the difference was 4.6%. As no significant correlation was found between stroke rate and final placing in championship finals, the mean stroke rate of all finalists was taken as the target value for each boat class, which average value for all boats was highest for elite athletes at 38.9 spm, while it was 37.3 spm for U23 rowers (-4.1% lower) and 36.6 spm for U19 rowers (-5.9%).
We won’t bore our readers with detailed description of the modelling method, which can be found in the full version of this Newsletter.
Tables 1–3 below present the derived target values of the main biomechanical characteristics for three age categories. On average, the forces produced by U23 rowers were 4.3% lower than those of Olympic-level athletes, while the difference for U19 rowers was 8.9%. In contrast, stroke length differed very little between age categories: for U23 rowers it was only 0.3% shorter than for adults, while for U19 rowers the difference was 0.7%. This agrees with observations and measurements: young rowers differ little from adults in stroke length and may sometimes even exceed them, possibly owing to greater flexibility.
The developed method makes it possible to link race analysis (rowing speed and stroke rate) with the corresponding technical and physical characteristics (rowing power, work per stroke, stroke length, and average and maximum handle forces). The model has been implemented as an online calculator on https://biorow.com/online_services/ , where subscribers can evaluate their own data. For coaches, these target values provide an objective benchmark for assessing training and improving rowing technique, thereby supporting the technical and physical development of rowers of different ages and performance levels.
This is a short version of the Newsletter. To access the full text, please subscribe to BioRow membership here: https://biorow.com/membership/
©2026 Dr. Valery Kleshnev
Table 1. Target characteristics of elite rowers of Olympic level.
| Boat class | Time (m:s) | Stroke Rate (spm) | Rower’s Weight (kg) | Inboard (cm) | Rowing Power (W) | WPS (J) | Oar Angle (deg) | Average Force (N) | Max. Force (N) |
| M1x | 6:32.5 | 38.0 | 90 | 88.0 | 548 | 865 | 106 | 457 | 815 |
| M2x | 6:02.1 | 39.0 | 90 | 87.5 | 505 | 777 | 105 | 418 | 743 |
| M4x | 5:33.2 | 40.0 | 90 | 87.0 | 483 | 724 | 107 | 382 | 699 |
| M2- | 6:16.5 | 38.0 | 95 | 115.0 | 462 | 729 | 86 | 390 | 767 |
| M4- | 5:41.0 | 39.0 | 95 | 114.0 | 464 | 714 | 87 | 380 | 746 |
| M8+ | 5:18.6 | 40.0 | 95 | 113.0 | 464 | 695 | 88 | 364 | 729 |
| W1x | 7:11.5 | 36.0 | 75 | 88.0 | 388 | 647 | 102 | 361 | 651 |
| W2x | 6:39.5 | 37.0 | 75 | 87.5 | 344 | 558 | 102 | 316 | 569 |
| W4x | 6:08.5 | 38.0 | 75 | 87.0 | 325 | 513 | 102 | 288 | 533 |
| W2- | 6:52.9 | 38.0 | 80 | 116.0 | 322 | 508 | 83 | 285 | 559 |
| W4- | 6:17.0 | 39.0 | 80 | 115.0 | 314 | 482 | 83 | 270 | 530 |
| W8+ | 5:53.1 | 40.0 | 80 | 114.0 | 319 | 478 | 84 | 264 | 529 |
Table 2. Target characteristics of young rowers under 23.
| Boat class | Time (m:s) | Stroke Rate (spm) | Rower’s Weight (kg) | Inboard (cm) | Rowing Power (W) | WPS (J) | Oar Angle (deg) | Average Force (N) | Max. Force (N) |
| M1x | 6:43.0 | 36.4 | 88 | 88.0 | 502 | 827 | 106 | 438 | 788 |
| M2x | 6:11.8 | 37.4 | 88 | 87.5 | 461 | 740 | 104 | 400 | 717 |
| M4x | 5:42.1 | 38.4 | 88 | 87.0 | 441 | 690 | 106 | 365 | 674 |
| M2- | 6:26.6 | 36.4 | 93 | 115.0 | 422 | 695 | 86 | 373 | 739 |
| M4- | 5:50.1 | 37.4 | 93 | 114.0 | 424 | 680 | 86 | 364 | 719 |
| M8+ | 5:27.1 | 38.4 | 93 | 113.0 | 425 | 664 | 87 | 348 | 705 |
| W1x | 7:23.0 | 34.5 | 73 | 88.0 | 356 | 618 | 102 | 346 | 628 |
| W2x | 6:50.2 | 35.5 | 73 | 87.5 | 314 | 532 | 101 | 302 | 548 |
| W4x | 6:18.4 | 36.4 | 73 | 87.0 | 296 | 488 | 101 | 275 | 513 |
| W2- | 7:03.9 | 36.4 | 78 | 116.0 | 294 | 484 | 83 | 272 | 538 |
| W4- | 6:27.1 | 37.4 | 78 | 115.0 | 286 | 459 | 83 | 258 | 510 |
| W8+ | 6:02.6 | 38.4 | 78 | 114.0 | 292 | 457 | 84 | 252 | 511 |
Table 3. Target characteristics of young rowers under 19
| Boat class | Time (m:s) | Stroke Rate (spm) | Rower’s Weight (kg) | Inboard (cm) | Rowing Power (W) | WPS (J) | Oar Angle (deg) | Average Force (N) | Max. Force (N) |
| M1x | 6:51.5 | 35.7 | 86 | 88.0 | 468 | 787 | 106 | 418 | 755 |
| M2x | 6:19.6 | 36.7 | 86 | 87.5 | 429 | 702 | 104 | 380 | 686 |
| M4x | 5:49.3 | 37.6 | 86 | 87.0 | 409 | 653 | 106 | 347 | 644 |
| M2- | 6:34.7 | 35.7 | 91 | 115.0 | 392 | 659 | 85 | 355 | 706 |
| M4- | 5:57.5 | 36.7 | 91 | 114.0 | 393 | 644 | 86 | 346 | 687 |
| M8+ | 5:33.9 | 37.6 | 91 | 113.0 | 396 | 632 | 87 | 333 | 676 |
| W1x | 7:32.3 | 33.8 | 71 | 88.0 | 331 | 587 | 102 | 330 | 601 |
| W2x | 6:58.8 | 34.8 | 71 | 87.5 | 292 | 503 | 101 | 287 | 523 |
| W4x | 6:26.3 | 35.7 | 71 | 87.0 | 275 | 462 | 101 | 261 | 489 |
| W2- | 7:12.8 | 35.7 | 76 | 116.0 | 273 | 458 | 83 | 258 | 513 |
| W4- | 6:35.2 | 36.7 | 76 | 115.0 | 265 | 434 | 82 | 245 | 487 |
| W8+ | 6:10.2 | 37.6 | 76 | 114.0 | 272 | 434 | 84 | 241 | 489 |
Welcome Back 👋
Sign in to access your account and continue where you left off.
Welcome aboard 🚀
Create your account to access everything you need.