
Did you know that, recently, BioRow has developed a new measurement method for determining the propulsive force acting on a boat hull during rowing. The new method could provide very valuable information on the efficiency of the rower-boat-oar system, which could be used to evaluate both rowing technique and equipment quality.
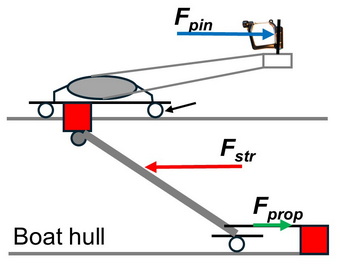
In a single scull (WinTech Competitor for 90-105 kg, 18.4 kg hull mass including the measuring equipment), the stern-positioned wing rigger without backstays was mounted on linear bearings. The top bar of the stretcher was connected to the rigger through two sensors, which measured the left and right forces between the stretcher and the rigger in the horizontal direction only. The bottom of the stretcher plate was also mounted on a linear bearing and connected to the bottom of the boat hull through a third force sensor. With this design, the rigid system consisting of the rigger and firmly connected stretcher was able to slide freely by approximately 3 cm along the hull on three linear bearings, which neutralised all vertical and lateral forces. The transmission of horizontal force between the system and the hull was provided only through force sensor 6, which was supposed to measure the propulsive force acting on the hull.
Data were collected from two male scullers (mean height 1.92 m, body mass 89 kg), who performed five 250 m trials with freely selected rest periods at stroke rates of 20, 24, 28, 32 and 36 spm under mild wind conditions.
During steady-state rowing in each trial, the mean magnitude of the propulsive force Fprop acting on the hull over the stroke cycle must be equal to the mean magnitude of the drag force Fdrag, which should be related to the mean squared rowing speed v and drag factor DF as:
Fprop = Fdrag = DF v2 (1)
The data revealed a very high correlation (r = 0.994) for this relationship, with a mean DF of 2.357 kg/m, which supports the appropriateness of the measurement method.
The product of the mean propulsive/drag force Fprop and rowing speed v represents the propulsive power Pprop, i.e. the energy expended per unit time to overcome water drag resistance acting on the hull. A high correlation (r = 0.978) was found between traditionally measured rowing power (as a product of the handle force and velocity) and propulsive power Pprop. The slope of the regression line was 0.521, which means that the mean overall rowing efficiency was only 52.1%, and that 47.9% of the energy produced by the rower was dissipated somewhere in the system, which was quite surprising finding.
In attempting to identify the reasons for this low overall rowing efficiency, it could be speculated that 22% of the energy was expended due to blade slippage, because the mean blade efficiency in these trials was approximately 78%. Another 6% of the energy loss could be explained by variations in boat velocity during the stroke cycle. Water drag represents approximately 87% of the total resistance, while the remaining 13% is related to air resistance above the waterline (Klaus Filter, 2004). Air resistance was not measured with the current method and therefore accounts for another approximately 7% of rowing power. The sum of these factors explains only 35% of the energy losses, leaving the reasons for the remaining 13% unclear.
As expected, the drag force was negative during the recovery (oppositely directed to the boat velocity), and its magnitude increased with stroke rate. The mean magnitude of Fdrag during the recovery increased from 46 N at 20 spm (rowing speed 3.37 m/s) to 87 N at 36 spm (4.59 m/s). However, during the drive, the drag force exhibited two positive peaks:
It could be speculated that one reason for these positive peaks in the drag force could be friction associated with seat movement on the slides, which pushes the boat forward during the drive. Another possible reason could be contact between the calves and the boat deck. This means the method should be perfected by measuring these additional contact forces.
This is a short version of the Newsletter. To access the full text, please subscribe to BioRow membership here: https://biorow.com/membership/
©2026 Dr. Valery Kleshnev
Welcome Back 👋
Sign in to access your account and continue where you left off.
Welcome aboard 🚀
Create your account to access everything you need.