
Did you know that, …propulsive forces and the associated drag forces are key performance indicators (KPIs) in rowing biomechanics, connecting the energy-producing system (the rower, oars and force-transmission parts: oarlocks, rigger and stretcher) with the energy-consuming components – the boat shell and the water. Therefore, reliable information about propulsive and drag forces would allow us to estimate overall rowing efficiency, optimise all parts of the rowing system and enhance performance. Here, we continue this analysis.
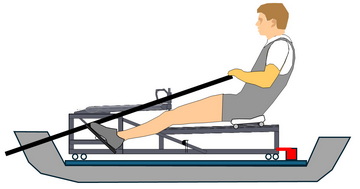
Our first attempt to estimate propulsive and drag forces was made in 2019, when the pin and stretcher forces were measured and summed. In the previous experiment with the sliding rigger–stretcher system (RBN 2026/09), the abnormal positive peaks in the propulsive and drag forces were suspected to result from horizontal forces between the seat and the slides. This factor has now been eliminated using our new equipment design. A sculling apparatus was constructed, consisting of a frame with slides and a seat, a stern-mounted wing rigger with oarlocks, and a foot stretcher. The apparatus was mounted on four linear bearings attached to a wooden plate and connected to the plate through a force sensor. The plate and apparatus were installed in an inflatable kayak (Mousa; hull mass, including the plate 30.2 kg). With this design, all horizontal propulsive force between the apparatus and the hull was transmitted through the sensor alone. All other forces (at the oarlocks, stretcher, and between the seat – slides) were internal to the apparatus.
Data were collected from a male sculler (1.88 m; 85 kg), who performed six 200 m trials, one at each stroke rate of 16, 18, 20, 24, 28 and 32 spm, with free rest periods, in a light tailwind.
The propulsive and drag forces obtained using all three methods (published in RBN 2019/01, RBN 2026/09 and the current study) were compared at 32 spm. As the kayak’s speed in the current experiment was 17.5% lower, handle velocity was also lower and drive time was longer, but handle force was higher. Before the catch, the propulsive forces were quite similar across all three methods. At the catch, however, the negative peak was significantly deeper in the latest experiment because the kayak was 12 kg heavier. During the drive, the propulsive forces measured using the first and latest methods were very close, but the second method produced much lower values here. This was clearly a result of friction in the bearings caused by the high loads, which was a serious limitation of the second method.
A comparison drag forces measured using the first and latest methods showed very similar values at the beginning of the drive, when the rower’s weight was suspended and the force at the slides was minimal. During the second half of the drive and the beginning of the recovery, the magnitude of the drag force obtained using the first method was about 40 N greater. This could be explained by the transfer of the rower’s weight onto the seat, which creates a horizontal force at the slides, increases the boat’s forward acceleration and appears as an increase in the magnitude of the negative drag force. This slides force has two components:
This means that the horizontal force at the slides is equivalent to about 5% of the peak handle force and would consume 2–3% of the energy produced by the rower during the drive. The energy associated with the gravitational component is not completely lost, as it helps the rower move during the recovery. Friction force represents a pure loss of about 1% of the rower’s energy and should be minimised.
In the current method, the drag force still exhibited small positive values during the drive, which is physically implausible: drag cannot push the boat forwards. It was suspected that this phenomenon could be related to the substantial boat pitch amplitude of 6° in this short hull (only 4.5 m long), with pitch ranging from −3.5° at the catch to +2.5° at the finish. This is three times the typical pitch amplitude of 2° in conventional racing singles. The corrected curve had no positive values and was more physically plausible.
Finally, this analysis may help refine methods for determining propulsive and drag forces and extend our knowledge of the mechanics of the rower–boat–oar system.
This is a short version of the Newsletter. To access the full text, please subscribe to BioRow membership here: https://biorow.com/membership/
©2026 Dr. Valery Kleshnev
Welcome Back 👋
Sign in to access your account and continue where you left off.
Welcome aboard 🚀
Create your account to access everything you need.