“Gold target times,” or the prognostic speed of future regatta winners, is a popular topic among rowers and coaches. Since the race distance for the Los Angeles 2028 Olympics has been shortened to 1500m, the prognostic speed cannot be derived simply by proportionally shortening the target times for the 2000m race. This is because athletes will be able to generate more power and achieve higher speeds in shorter races. The key question to be answered is: “How much faster will a 25% shorter race be compared to the standard 2000m distance?”
To address this question, we studied the relationship between race speed, distance, and duration. Since no such data exists for on-water rowing, we analyzed world records on the Concept2 rowing machine across 26 elite events, both male and female, covering race distances from 100m to 42,195m. Additionally, we examined 28 world records in track running over comparable distances.
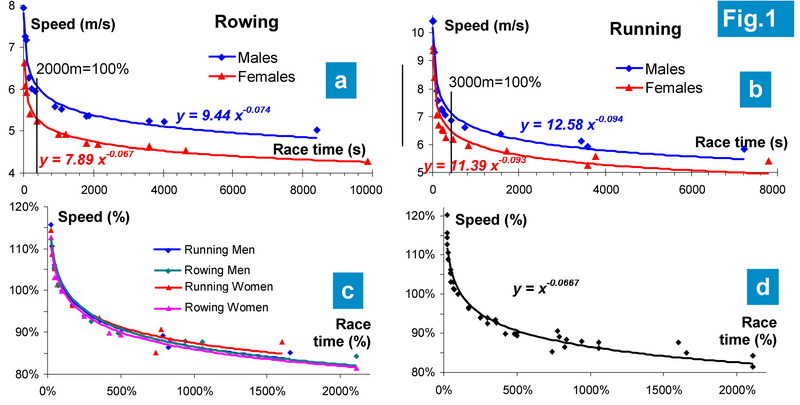
Our analysis found that the power equation v=a tb provides the best approximation of the relationship between speed (v) and race duration (t). Figures 1a and 1b illustrate this data along with fitted power functions. The speed and associated equations differed for males and females as well as between rowing and running. These findings align well with the well-established Power-Law (Kennelly) model (3,6).
In an effort to identify a universal trend, we normalized the data: the speed (v2000) and duration (t2000) of the standard 2000m rowing race were set to 100%, and results for other distances were expressed as ratios relative to these values. Since running speeds were generally higher than rowing speeds, the results for the 3000m running race – duration of which is similar to that of the 2000m rowing race (~7 minutes) – were used as a benchmark (100%).
Deviations from the regression line were analyzed, revealing that sprint distances (100-400m) were outliers, likely due to their reliance on different energy systems (e.g., higher phosphate and anaerobic energy contributions). Consequently, short distances were excluded, and only race durations exceeding two minutes were considered. This approach is well-documented in relevant literature (2,4).
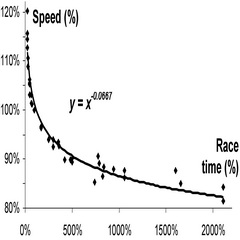
The power trends of the normalized data were remarkably similar across all rowing and running events, for both males and females (Fig. 1c-d). The general regression equation for all events (n = 43) was found to be v = t-0.0667 (R² = 0.96), which closely approximates v = 1 / t1/15. Using this equation, we estimated the effect of reducing the race distance to 75% of the standard: on average, the speed in a 1500m race should be 1.94% higher than in a 2000m race.
A 2% increase in speed may not seem dramatic, but achieving it would require approximately 6% more rowing power. As aerobic capacity reaches its peak after three minutes, this power excess would be covered by anaerobic energy sources. Table 1 below illustrates a possible model for this, using the assumption that the typical aerobic/anaerobic distribution in a 2000m race is 85%/15% (1,5) and using rowing power output of 500W as an example (%% doesn’t depend on the last). A 6% higher power demand in a 1500m race would shift the distribution to 80%/20%, requiring a 40% increase in the anaerobic power, meaning that a similar amount of anaerobic energy would be spent in a shorter time.
| Table 1 | Power 2000m (%) | Power 2000m (W) | Energy 6min (kJ) | Power 1500m (W) | Power 1500m (%) | Energy 4.5 min (kJ) |
| Total | 100% | 500 | 180 | 531 | 100% | 140 |
| Aerobic | 85% | 425 | 153 | 425 | 80% | 113 |
| Anaerob. | 15% | 75 | 27 | 106 | 20% | 28 |
Implications for Athletes and Training
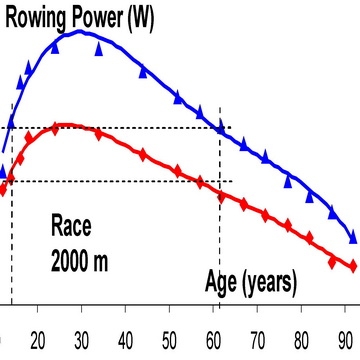
The increased demand for anaerobic capacity would favour larger, stronger, and faster athletes, while endurance-based rowers may be at a disadvantage. This shift would necessitate adjustments in training methods, emphasizing more speed and interval training while reducing long steady-state mileage. Additionally, racing stroke rates may increase further, requiring lighter rigging and/or shorter stroke lengths.
Developing Target Speeds for the 1500m Olympic Regatta in 2028
The following methodology was used:
- Target times for the standard 2000m race were derived based on trends from World Championship winners over the past 30 years.
- Target speeds were adjusted for the shorter race duration using the power equation above, increasing by 1.94%.
- Target times for the 1500m race were calculated based on the adjusted speeds.
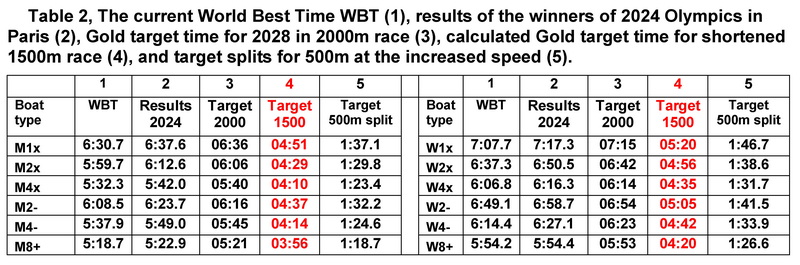
Table 2 below presents these target times, with the last column “Target 500m splits” illustrating the impact of the shorter distance on speed.
Expected Effects on the Sport of Rowing
Potential Benefits: More exciting, fast-paced races that could enhance TV broadcasting appeal. The emergence of new rowing stars, potentially elevating the sport’s profile. Opportunities for new training methods and equipment advancements.
Potential Drawbacks: A break from tradition, making historical race comparisons impossible. No new Olympic or world records in the standard 2000m format. Possible erosion of rowing identity as an aerobic endurance sport.
Impact on athlete selection and career development should also be considered, with it potentially favouring power-based rowers over endurance specialists. Another question to be answered is: “Should we run selection races at the standard 2000m distance? Or, switch it to the new 1500m format?”
References
- Astridge D.J., Peeling P., Goods P.S.R, Girard O., Hewlett J., Rice A.J., Binnie M.J. (2023) Rowing in Los Angeles: Performance Considerations for the Change to 1500 m at the 2028 Olympic Games. International Journal of Sports Physiology and Performance, 2023, 18, 104-107. https://doi.org/10.1123/ijspp.2022-0231
- Carbone V., Savaglio S. (2001) Scaling laws and forecasting in athletic world records. J Sports Sci. 2001 Jul;19(7):477-84. doi:10.1080/026404101750238935
- Katz S., Katz L. (1999). Power laws and athletic performance. Journal of Sports Sciences, 17(6), 467–476. https://doi.org/10.1080/026404199365777
- Kramer, M., Thomas, E.J. & Pettitt, R.W. Critical speed and finite distance capacity: norms for athletic and non-athletic groups. Eur J Appl Physiol 120, 861–872 (2020). https://doi.org/10.1007/s00421-020-04325-5
- Tuhin K. Roy,Michael J. Joyner,Jonathon W. Senefeld,Chad C. Wiggins, and Timothy W. Secomb (2024) An empirical model for world record running speeds with distance, age, and sex: anaerobic and aerobic contributions to performance. Journal of Applied Physiology Vol. 137, No. 2 PubMed 38932687 https://doi.org/10.1152/japplphysiol.00033.2024
- Vandewalle H. (2018) Modelling of Running Performances: Comparisons of Power-Law, Hyperbolic, Logarithmic, and Exponential Models in Elite Endurance Runners. BioMed Research International Volume 2018, Article ID 8203062, 23 p. https://doi.org/10.1155/2018/8203062
©2025 Dr. Valery Kleshnev