Effect of stroke rate on rowing technique
Stroke rate is an incredibly important factor of rowing technique, and every time we have discussed biomechanical variables and indicators, we mentioned their dependence on the stroke rate. Previously this topic was scattered around many publications, but here it is summarised in one place to give a clearer and more solid picture.
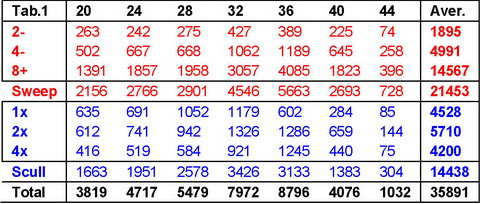
The BioRow database of measurements taken between 2012-2019 with nearly 36k samples was used for analysis. For the most part, the measurements were taken during the standard BioRow test protocol (2km step rate, RBN 2013/04). The samples were grouped around the stroke rates integer values divisible by 4, i.e. the range of stroke rates 18-22spm was grouped as 20spm, 22-26 – as 24spm, etc., and all biomechanical indicators were averaged within each group. Table 1 shows the number of data samples in each group in six boat types:
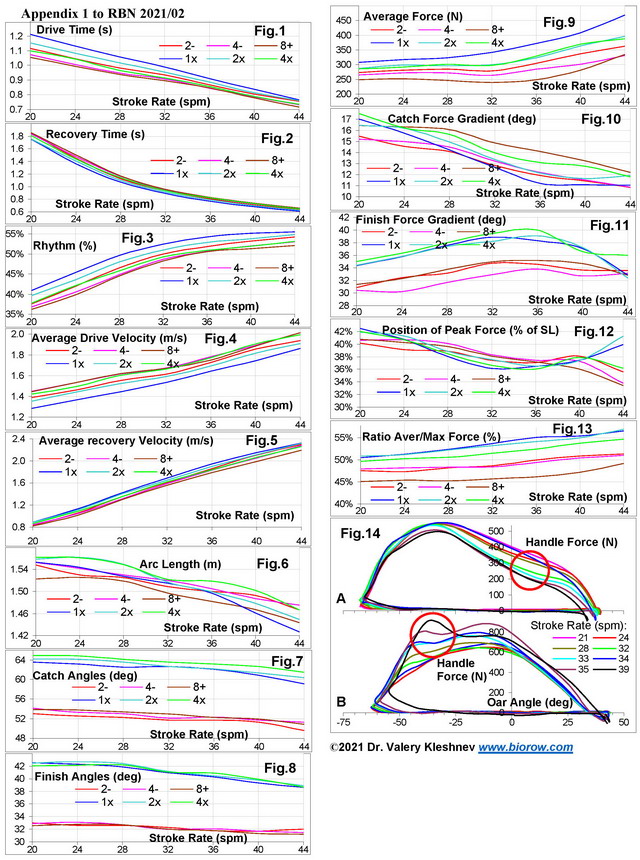
It is trivial that timing indicators are directly affected by the stroke rate because the cycle time gets shorter at increasing rates. The drive time (Fig.1 in the Appendix) has the highest correlation with the stroke rate (from 0.9980 in 8+ to 0.9999 in 1x). On average, the drive time shortens very linearly by 15ms for every 1spm of the stroke rate increasing, so it shortens by 1/3 from 20 to 44spm. As expected, singles have the longest (0.91s at 36spm) drive time and the eights – the shortest (0.85s at 36spm). On average, females had 5.0% longer drive time than males; lightweights – 1.4% longer than heavyweights, which is related to the differences in rowing speed.
The recovery time shortens by 47ms for every 1spm of higher stroke rate, so at 44spm it becomes three times shorter than at 20spm (Fig.2). However, the trends are non-linear with a steeper section at 20-32spm (74ms per 1spm), flatter part at 32-40spm (21ms/spm) and very small decrease after 40spm, which means it is practically impossible to shorten recovery time below 0.5-6s. In small boats, recovery times were slightly shorter (0.77s in 1x at 36spm) than in big boats (0.83s in 8+ at 36spm); for lightweights it 1% was shorter than for the heavies, and no significant differences were found between the gender categories.
The rowing rhythm (a share of the drive, in cycle time, Fig.3) increases with stroke rate due to different trends of the drive and recovery times. On average, the rhythm increases by 0.65% per 1spm, but nonlinearly: steeper at 20-32spm (1.0%/spm) and then much flatter (0.25%/spm). Small boats always have higher rhythm values (54.2% in 1x at 36spm) than in big ones (50.6% in 8+), because they have longer drive and shorter recovery times. Females and lightweights had about 1% higher rhythm values than male and heavyweights.
Changes in timing with increasing stroke rate have two reasons: 1) increase of the rowing speed related to increase of the handle speed; 2) shortening of the drive length at higher rates. Average handle velocity during the drive (Fig.4) increases about 40% between rates 20 and 44spm, which corresponds to the same increase of rowing speed. Recovery speed (Fig.5) increases nearly three times, because it is not related to rowing speed (blade is disconnected during recovery): rowers move faster at higher rates, so spend more energy on the recovery.
On average, the arc length (at the middle of the handle, Fig.5) shortens about 6% between 20-44spm, slightly more in sculling boats (7%) then in sweep (5%). Females had 3.6% shorter arc length than males, but negligible difference was found between heavyweights and lightweights. In sculling, catch and finish angles decrease at higher rates equally by 3.5% (Fig.7,8), in sweep boats, the catch shortens more (3.5%) than the finish (1.5%). On average, females had 2deg shorter catch angle than males, and no significant difference was found in finish angles and between weight categories.
Average force (Fig.9) is nearly constant at low rates below 32spm, and continuously increases at higher rates (although this could be related to the test protocol). The highest average force was measured in small boats and in male open-weight categories: 2- had 15% higher average force than 8+, 1x - 8% higher than 4x. Males had 34% higher force than females; open category – 12% higher than lightweights.
The force curve increases steeper at higher rates: Catch Gradient (Fig.10) gets shorter by 4-5deg. The Finish Gradient (Fig.11) increases by 3-4deg from 20 to 36spm, then it is gets shorter again, which could be related to a faster trunk return “through the handle” at the finish. The peak force occurs earlier at high rates (Fig.12): its position moves towards the catch by 3-6deg. The shape of the force curve became more rectangular at high rates: ratio of average/maximal force (Fig.13) increased by 4-6%.
Female rowers have a 1.5deg steeper Catch Force Gradient, but this could be related to lower peak force (gradient is taken at 70% max force). Males have significantly (4-7deg) shorter Finish Force Gradient: they usually maintain higher force at the finish because of stronger upper body muscles.
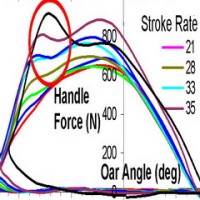
The following two particular examples illustrate changes in the force curve at increasing stroke rate (Fig.14):
A. International level female sculler. At increasing stroke rate, the force curve practically doesn’t change at the catch and the peak force position stays in the same position. The main difference was found during the second half of the drive, where the force significantly decreases, because this rower doesn’t have enough upper body power to maintain force at increasing handle velocity.
B. National level male sculler. At low rates, the force curve grows very slowly because of “catch through the handle” technique with very early “opening the trunk”. At increasing rate, the Catch Gradient gets much steeper, but the force curve “breaks” at the “transition point” (about 90deg knee angle) and max. legs velocity.
Conclusions: Rowing Biomechanics and technique are very different at low and high stroke rates. The main differences of high-rate rowing are: much shorter timing, faster movement velocities, higher requirements for force and power.
Acknowledgments. Thanks to Miles Forbes-Thomas for very specific questions and idea of this Newsletter.
©2021 Dr. Valery Kleshnev www.biorow.com