


HDF indicator in more detail
The HDF indicator of
rowing “heaviness” was previously studied (RBN 2020/01-02) in a general sense,
and here it will be discussed in more detail.
Firstly, we need to
clarify technical issues about HDF definition, which is based on the handle
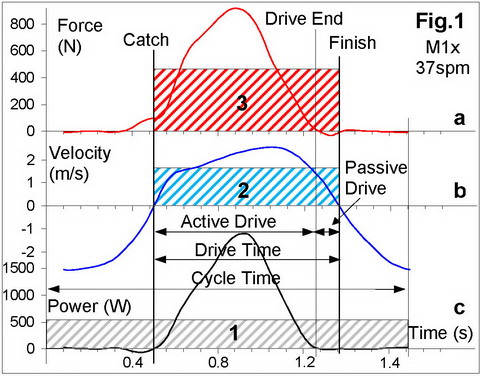
force, velocity and rowing power (Fig.1). The original definition (let’s call
it HDFP) was the ratio of rowing power over the stroke
cycle Pc to the cube of the average handle velocity
during the drive vav :
HDFP = Pc
/ vav3 (1)
The
area under the instantaneous power curve (Fig.1,c) represents work per stroke, so
the rowing power is equal to the height Pc of
rectangle 1 of the same area distributed over the time of the stroke cycle. The
area under the instantaneous velocity curve (Fig.1,b) represents handle travel,
so the average handle velocity is equal to the height vav
of rectangle 2 of the same area distributed over the drive time only (because
the handle travel during the cycle is zero). Here is the first discrepancy:
power Pc is calculated over the whole cycle time, but
velocity vav – only during the drive time, so rowing
rhythm (ratio of the drive to the cycle times) would affect HDFP
defined in this way.
The second discrepancy can
be found between the originally defined HDFP and its
definition through the average force HDFF:
HDFF = Fav
/ vav2 (2)
The area under the force
curve (Fig.1,a) represents the impulse produced by a rower, so the average force
is equal to the height Fav of rectangle 3 of the same
area distributed over the drive time. Even if we spread Fav
over the cycle time (multiply it by the rhythm value), HDFF
would not be equal to HDFP, and would have 15-20%
lower values.
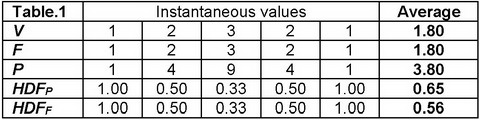
This is a consequence of some simple maths: instantaneous values of HDFP and HDFF are equal by definition, but their values calculated from average force, velocity and power are not equal. Table 1 illustrates this on a simple numerical model. The problem could be solved, if we derive instantaneous HDF and take its average over the drive time, but this is not possible because HDF is not defined at the catch and finish, when velocity is zero, and its magnitudes are enormously high near these points, when velocity is low.
If we look closer to the force and power production, they drop below zero some time before the finish, but the handle continues to move with positive velocity until the very finish. Let’s call the duration of the drive with positive force and power values “Active drive” and the remainder – “Passive drive”. Usually, the blade is already out of water during the Passive drive, and this time is required to wrap up the drive. It would be logical to count the rowing “burden factor” only during the Active drive and derive HDF through corresponding force, velocity and power. This would give us two more definitions: AHDFP - active HDF derived through power, and AHDFF – active HDF derived through force.
To find a reference point
and choose the most adequate HDF definition, it was derived as an average HDFav
of its instantaneous values during that part of the drive, when the centre of
blade is buried under the water (vertical oar angle is negative).
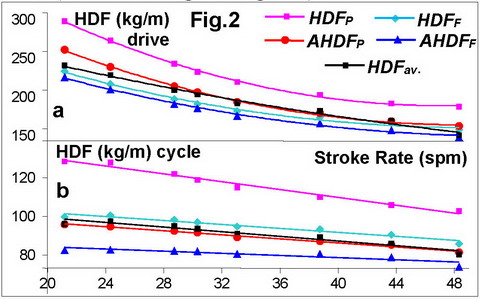
Fig. 2 shows all five HDF definitions
above derived for the drive time only (a) and for the whole cycle time (b). The
data is for the same 1x as was shown in RBN 2020/02, Fig.2. HDF values for the
drive (a) are higher and much more dependent on the stroke rate: they decrease
at higher rates more significantly. This means the drive feels heavier at
low rates and lighter at high rates, because recovery time gets significantly
shorter and the system velocity decreases less at the start of the drive. If
HDF is distributed over the whole cycle time, it is less dependent on the
stroke rate, because heavier drive at low rates is balanced by longer
recovery time.
It looks like values of AHDFP
and HDFF are the closest to HDFav
taken as a reference, so they could be recommended as the most adequate
indicators of a “burden factor” in rowing.
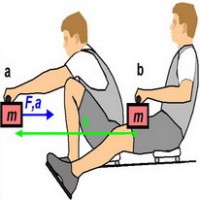
Now, we will discuss the
physical interpretation of HDF, which can be illustrated with the
following simple model (Fig.3). Imagine that a rower horizontally pulls a mass m
with a constant force F in ideal conditions without gravity and
friction.
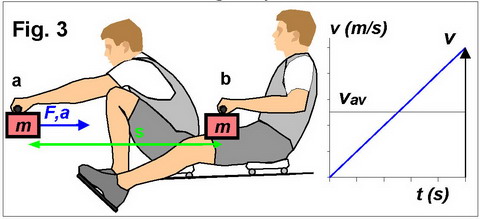
In this case, the acceleration
a of the mass m would also be constant:
a = F / m (3)
If the movement starts
from a stationary position (v0=0), after some time t,
the mass m would achieve its final velocity v
v = at (4)
and would travel the
distance s
s = 0.5 a t2
= 0.5 v t (5)
As the force and
acceleration are constant, the average velocity vav
over the time t would always be a half of the final velocity v:
vav = s /
t = 0.5 v = 0.5 at = 0.5 F t / m (6)
Square of the final
velocity v could also be expressed through acceleration a and
travel s as
v2 = 2 a
s = 4 vav2 (7)
Substituting acceleration a
with F/m and cancelling 2, we get
F s /m = 2 vav2 (8)
Finally, using the force
definition of HDF, we can define it as:
HDF = F / vav2
= 2 m / s (9)
This is the physical
interpretation: HDF equates to twice the mass-equivalent m divided by
a distance s, which it would travel, if there was a constant force
applied to this mass in ideal conditions without gravity and friction. The equation
9 confirms the dimensions of HDF as kg/m as mentioned before. Higher
HDF means a larger accelerating mass, or shorter distance of
travels, and vice versa. Mass-equivalent m could be determined
as:
m = 0.5 HDF s (10)
and the distance s equates:
s = 2 m / HDF (11)
Note that the force F,
time t and acceleration a are not included in the
equations 9-11, which means the same HDF could be achieved at various
combinations of the applied force F and its acting time t, as
well as at various ratios of mass equivalent m and its travel s.
Generally, at defined HDF,
mass m and travel s the force F required
to achieve a certain “drive time” t would be
F = HDF vav2
= HDF s2 / t2 = 2 m s / t2 (12)
If the drive time t
needs to be found at a known HDF, mass m , travel
s and force F, then
t = s (HDF / F)0.5
= (2 m s / F)0.5 (13)
The equations above show
that the average force is inversely proportional to the square of the drive
time, which means to shorten the drive time twice, four time higher
force required, and vice versa.
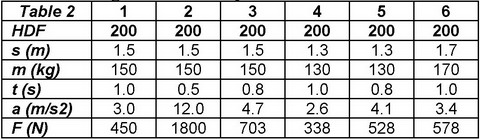
Table 2
illustrates the equations numerically. The same HDF = 200,
typical for a single (Fig.2,a), could be achieved, if a rower would apply a
constant 450N force to a 150kg mass, which would travel a distance 1.5m during
1s (column 1). These are quite typical numbers for the average force, mass of
the rower-boat system (with added water mass), stroke length and drive time for
elite scullers. If rowers want to decrease drive time down to 0.5s at the same
conditions (2), then they must increase force up to 1800N. Drive time 0.8s
would require 703N of force (3). Shortening the stroke length down to 1.3m for
the same 1s drive time (4) would mean a smaller mass-equivalent of 130kg and lower
applied force 338N, etc.
As the
applied force is directly proportional to HDF at a given average velocity,
rowers applying relatively higher force in crew boats would have higher HDF, if
they try to maintain the same the stroke length and drive time with other crew
rowers.Table 2 illustrates the equations numerically. The same HDF
= 200, typical for a single (Fig.2,a), could be achieved, if a rower would
apply a constant 450N force to a 150kg mass, which would travel a distance 1.5m
during 1s (column 1). These are quite typical numbers for the average force,
mass of the rower-boat system (with added water mass), stroke length and drive
time for elite scullers. If rowers want to decrease drive time down to 0.5s at
the same conditions (2), then they must increase force up to 1800N. Drive time
0.8s would require 703N of force (3). Shortening the stroke length down to 1.3m
for the same 1s drive time (4) would mean a smaller mass-equivalent of 130kg
and lower applied force 338N, etc.
To verify this conclusion,
relative indicators HDFr were derived in each measured
crew boat:
HDFr =
HDFi / HDFav (14)
where HDFi
is and individual indicator for each rower, HDFav -
average HDF of the crew in each data sample. In this way, HDFr
does not depend on the HDF definition and rowing
conditions, but depends only on its ratio for each rower in a crew. Similarly,
other important indicators were derived: relative catch, finish and total oar
angles, relative force and power.
Very high correlations
were found between HDFr and relative average force and
power: in eights it was r=0.81 (n=14606), in fours and quads r=0.82 (n=9321),
and in pairs and doubles r=0.77 (n=12295), which confirms the above hypothesis.
From first glance, this is quite a trivial and intuitive conclusion: rowers
“pulling harder” in a crew should always feel the rowing is “heavier”, but HDF
provides an adequate numerical indication of this fact, and it works as a good
proof of validity of this factor.
It is interesting that the
stroke length had practically no effect on relative HDFr and
their correlation was close to zero.
HDF could potentially be a very informative indicator
and play an important role in evaluation of rowing technique, rigging and
external rowing conditions.
©2020 Dr. Valery Kleshnev www.biorow.com