


Interpretation of the Blade Work variables

In this newsletter we will try to summarise previous
data about blade work, derive some benchmarks and make practical conclusions.
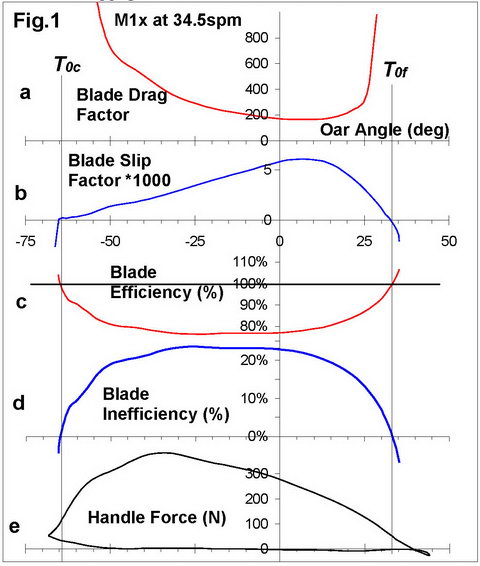
The blade Drag Factor DFb
(Fig.1,a) goes to infinity at two critical points (catch T0c
and finish T0f), where the blade velocity in the water
crosses zero, which makes it difficult to analyse. We therefore decided to
derive an inversed variable: Blade Slip Factor SFb
(Fig.1,b):
where Fb is
the normal blade force, and Vbb is the
normal component of the blade velocity in the water, including the oar bend. In
this way, SFb = 1 / DFb when
the blade velocity Vbb is positive, but
when Vbb
becomes negative at the catch and finish, SFb keeps its sign
and becomes negative as well. If DFb shows resistance to
the movement of the blade in the water, SFb indicates its
slippage, similar to electrical resistance and conductance.
Similarly, Blade Inefficiency Nb
(Fig.1,d) could be derived as a reversed variable to Blade Efficiency Eb
:
Where P is rowing power applied to the oar,
Pw
is the waste power of the blade slippage. As Nbl
= 1 - Eb, then Nb crosses zero and becomes
negative, when Eb becomes higher than 100% at critical points. If Eb
is part of the rowing power spent on propulsion, Nb is the
share of energy lost in the slippage of the blade in the water.
As the blade is only partially submerged before
and after the critical points T0c and T0f
(RBN 2018/06), we decided to analyse only the part of the drive between them.
Average blade Drag Factor DFb.a was derived:
DFb.a
= Fb.a / Vb.a2 = Fb.a / (Lb
/ Tc-f)2 (3)
where Vb.a is the average blade
velocity and Fb.a is the average blade force between the critical
points, Lb is the displacement (slippage) of the blade, time
Tc-f = T0f
- T0c.
A large data set measured with the BioRow
system (n=28252) was analysed using the above definitions of the blade work. High
positive correlation r=0.72 was found between
Blade Efficiency Eb and Drag Factor DFb, and the
same r between Nb and SFb,
which means the 51% variation of Eb is explained by the variation
of DFb
and vice versa. The remaining variation is related to an effect of the stroke rate
SR
and average boat speed Vb, where higher values
lead to a higher Eb (r=0.22
with SR
and r=0.28 with Vb), but lower
DFb
(r=-0.13 with SR and r=-0.18 with Vb). Correlations
with Nb
and SFb
were inversed to the above values. The interpretation of this is as follows:
·
Blade Efficiency is the measure of propulsive
power as a RELATIVE share in the total power, Efficiency increases at higher
rates and speeds. because the total power increases more dramatically than the blade
slippage.
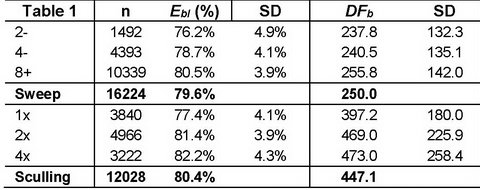
Average DFb of each sculling
blade was about 85% of one sweep DFb, so the total blade DFb
per sculler was more than 70% higher than one per rower (Table 1). However, the
blade efficiency Ebl was only 1% higher in sculling boats than in
sweep boats. Bigger boats had a slightly higher Ebl
and DFb.
In crew boats, rowers applying relatively
higher force and power usually have slightly lower Ebl
(r=-0.17 with relative power), and DFb
(r=-0.06).
Fig.1 clearly shows that blade efficiency Ebl
and DFb
are the lowest during the middle of the drive, (the highest Inefficiency Nbl and Slip Factor SFb).
If the duration of the propulsive phase from T0c
to T0f
is divided into three equal periods, then average values of Ebl are related as: 105.8%-96.2%-97.9%, and DFb: 107.5%-83.7%-108.8%
from the average values for the whole phase. This means, the beginning and end of the
drive are more efficient zones for blade propulsion, and most of the blade
slippage energy is wasted in the middle of the drive.