Case study on rowing efficiency
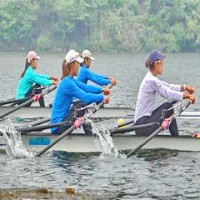
Interesting data was obtained recently: two LW2x performed the standard BioRow® test protocol (RBN 2013/03) side-by-side, so the weather conditions should be the same. Both crews had the same boat build (Filippi with bow-mounted carbon wing-riggers), oars (Croker Super light), very similar boat age (made in 2012 and 2013) and average rowers height and weight (1.72m / 59kg for crew 1, and 1.75m / 58kg for crew 2). Both boats were equipped with BioRowTel system calibrated in the same way.
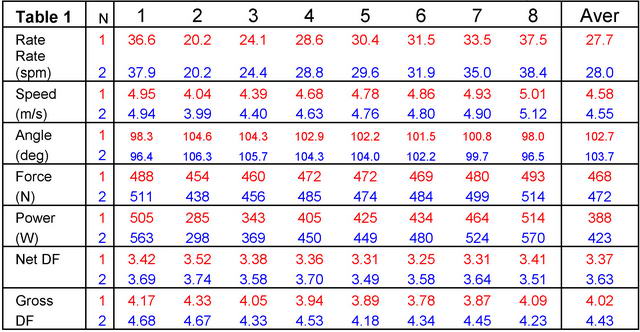
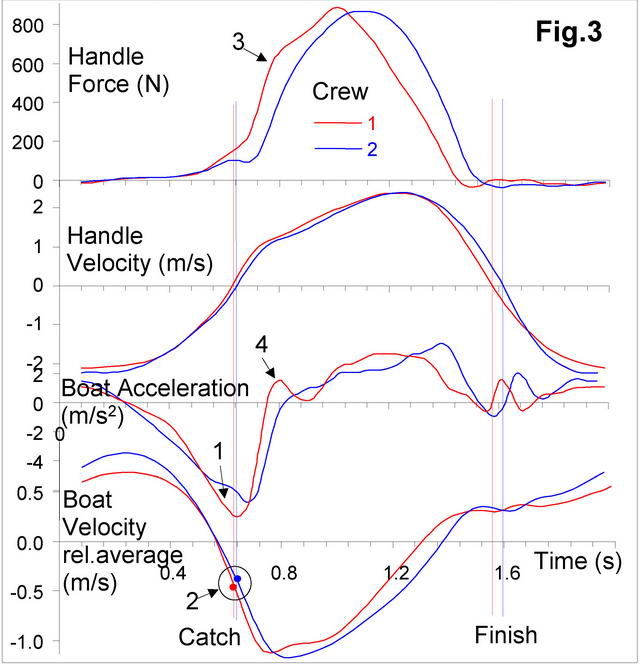
On average, crew 1 (Table 1, in red) had 1.1% lower stroke rate, 0.9% shorter stroke length, 0.9% lower force and 8.6% lower power, but 0.52% higher boat speed compare to the crew 2 (in blue). Therefore, drag factor of crew 1 was significantly lower in all samples (on average, 7.2% lower Net DF, and 9.7% lower Gross DF, RBN 2015/03). The obvious question is: how it was possible at the same weather, equipment and crews’ weight? What could be the reasons of higher rowing efficiency in crew 1 compared to crew 2? To answer these questions, biomechanical analysis was made at the sample 6 (31.5 and 31.9spm), where crew 1 was 1.3% faster.
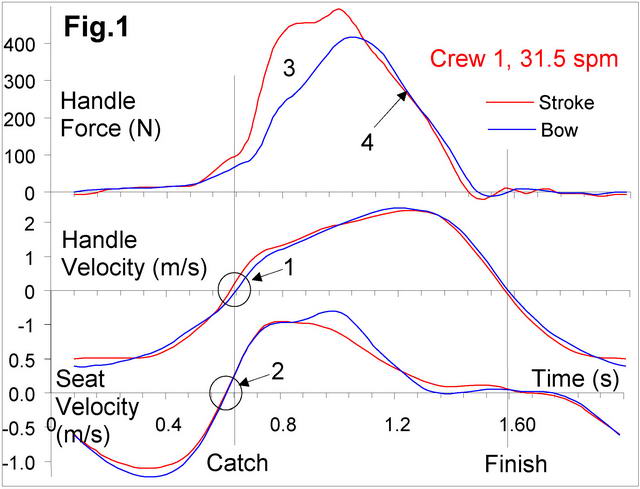
At catch, the crew 1 (Fig.1) had quite different timing at the handle (bow rower was 20ms later at change direction, 1), but very good synchronisation at the seat (less than 2ms difference, 2), which means rowers push the stretcher at the same time. The stroke rower applied a much higher force during the first half of the drive (3); then, the forces were quite similar (4). Catch Factors CF were quite similar in this crew (-10ms in stroke, and -27ms in the bow), as well as Rowing Style Factor RSF (80% and 90%).
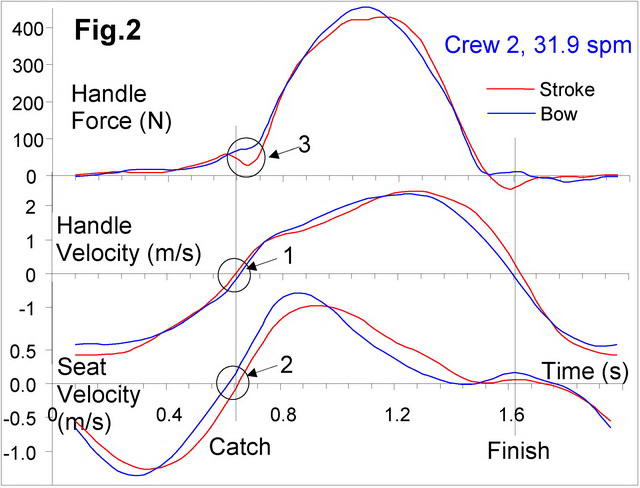
Contrarily, the crew 2 (Fig.2) had slightly better synchronisation at the handle (bow rower was 18ms later, 1), but much worse timing at the seat (bow rower overtook the stroke by 35ms), which means their stretcher forces were not synchronised. So, the CF was very different: +16ms in the stroke and -35ms in the bow, as well as RSF (79% and 98%). Force curves were quite similar in general, but the stroke rower had a significant gap after the catch (3), which means (after subtracting oar inertia force) she applied a negative (braking) force at the blade .