


Analysis of results of Worlds-2019 in Linz

The weather conditions in Linz were different during the two days of finals in the 14 Olympic boats: a cross-head wind made the speed quite slow on Saturday (3rd slowest average for those 8 events since 1992), but calm weather on Sunday allowed faster speeds (7th fastest). On average, this was the fifth slowest World regatta after 1992 (Fig.1).
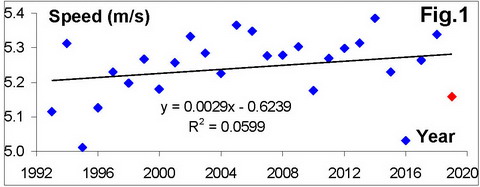
The weather in Linz made the general growth of the speed lower (0.29% per year) than after the previous year’s fast Worlds in Plovdiv (it was 0.41%). The difference in weather conditions increased the leading positions of both W8+ and M8+ in speed growth (about 1% per year, Table.1), which is more than two times higher than in LW2x and LM2x on the 3rd and 4th place.
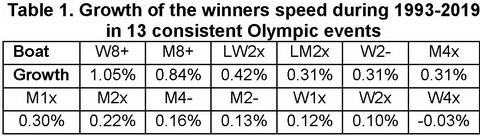
The slowest growth of the speed was found in all three women’s sculling events, where W4x was the only boat with a negative trend.
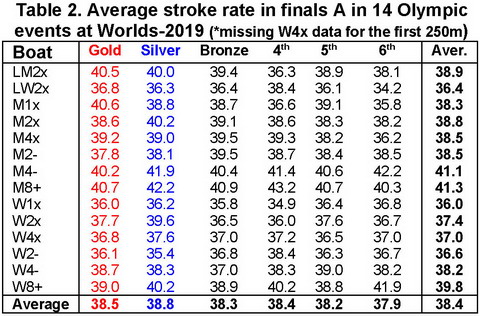
The average stroke rate in the 14 Olympic boat types (Table 2) was 38.4spm, which is 0.5spm lower than in the previous Worlds-2018 in Plovdiv. It looks like the rapid increase of racing stroke rates from 2017-18 has gone down. More than half of the winners in Olympic events (8 out of 14) won with a lower stroke rate than their competitors, which means they got an advantage because of higher effective Work per Stroke. In some boats (M2x, W2x, M4-, M8+, W8+), the winners rated 1.2-2spm lower than the silver medallists, so they took 8-14 less strokes over 2000m to overcome their competitors. In the dramatic M1x final, the silver and bronze medallists (Sverri Nielsen, DEN and Kjetil Borch, NOR, both BioRow clients) lost by only 0.03s and 0.29s, took 12-13 less strokes than the winner (Oliver Zeidler, GER). The 4th place (Mindaugas Griskonis, LTU) took 27 less strokes than the winner, but was only 0.69s behind him. This means, the advantage of a higher stroke rate is quite doubtful, and higher effective Work per Stroke may have a better potential for speed improvement.
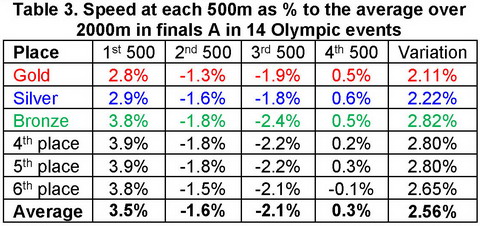
The racing strategy at the Worlds-2019 (Table 3) follows the trend found over the last two decades: the winners and silver medallists had the most even distribution of speed during the race, and the lowest variation; they were relatively slower at the start 500m, but had a relatively lower drop of the speed at the middle of the race.
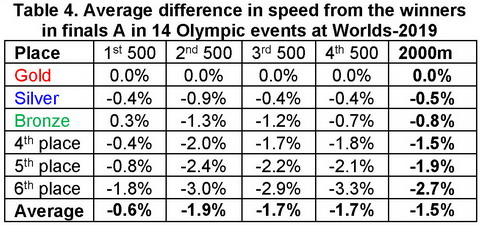
Analysing the absolute speed (Table 4), the winners were faster than other finalists at each section, except the first 500m, where bronze medallists were 0.3% faster than the winners. The main advantage was taken by the winners at the second 500m section, where they were 0.9% faster than their closest competitors.
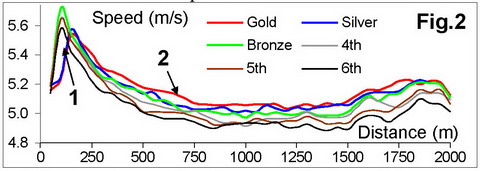
Fig.2 confirms the above conclusion with average data at each 50m section taken from GPS. The winners and silver medallists had the slowest burst of the speed at 100-150m after start (1), and the winners were significantly overtaking their competitors around the 750m mark (2).
©2019 Dr. Valery Kleshnev www.biorow.com