


Balance of forces on the boat hull
Experiments with comprehensive
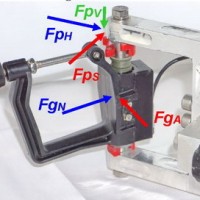
force measurements were conducted recently with new the BioRow
instrumented C-bracket, which was mounted on a wing rigger (Fig.1) and measured
3D force at the pin: in horizontal FpH, side FpS
and vertical FpV directions. Forces at the gate were measured
with the BioRow 2D instrumented
oarlock at the normal to the oar axis FgN
and axial direction FgA.
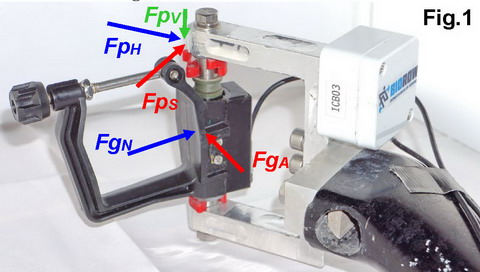
The stretcher force was determined
at three points with BioRow
v.2009 sensors (RBN 2013/08), which measured the horizontal force components FsH
only (Fig.2).
Other biomechanical variables
were measured with the standard BioRow
system (Fig.3): oar angles in horizontal Ah and vertical Av planes (RBN 2009/10),
seat and trunk movements (2014/12), boat speed, acceleration and rotations
(2012/03), wind speed and direction (2013/06).
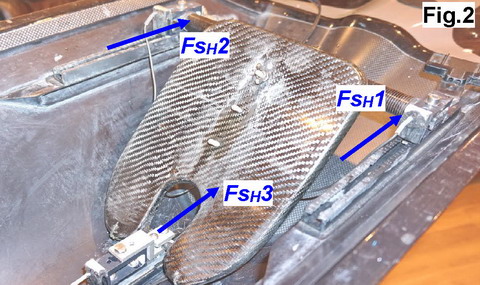
A male sculler (1.84m, 84kg) performed 8 short rowing pieces of ~200m each, increasing stroke rate from 17.2 up to 41.5 spm. The data for each sample was processed using the standard BioRow method (RBN 2017/12), and the penultimate sample of 35.5spm is presented below (Fig.3).
The sum of three stretcher
forces FsH was subtracted
from the sum of horizontal components of both pin forces FpH, which
resulted in propulsive force applied to the boat hull FbH (Fig.4):
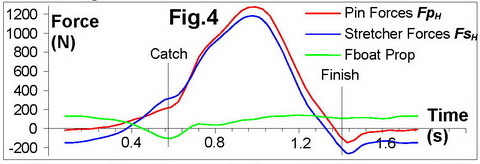
The propulsive force at the
boat FbH
is the sum of the boat inertia force mb ab (mb=16.7kg
is the full boat mass, ab is its acceleration)
and drag force at the hull Fd, which could be
determined directly from our measurements.
Fd = FbH
- mb ab (2)
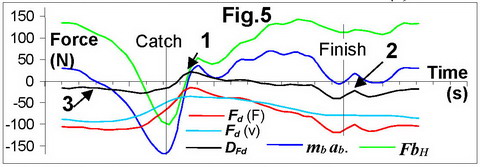
This drag force calculated
with our force measurements Fd(F) was compared with
the drag force calculated from the boat velocity v and drag factor DF:
Fd(v)=DF
v2, and the difference was determined as DFd=
Fd(F)- Fd(v).
The curves of the drag force
calculated with different methods appeared to be quite close (Fig.5). The small
difference could be explained by the force on the slides, which arises from two
factors: gravitation and friction. After the catch, the boat pitch has maximal
negative values of about -1deg (stern – down, bow - up), plus a 1deg slides
pitch relative to the boat. The rower’s mass moves slightly upwards, which
creates forward force at the slides Fsl=sin(Ap) mrg.
At the total slide angle Ap=2deg and the moving
rower’s mass mr=60kg (weight of legs subtracted), a force Fsl
of ~20N pushes the boat forward at slides, but it was not measured and
accounted for here in the force balance. Therefore, the drag force Fd(F)
was calculated higher than its real value (Fig.5,1).
During the drive, the boat
pitch became positive up to +1deg (stern goes up, bow – down), so the slide
angle became close to zero and only the friction force at the wheels of the
slide affects the total balance of forces. At the finish, this creates a few fluctuating
peaks (2), when the seat moves fore-aft and may hit back-stops. During the recovery,
the friction force at the seat pushes the boat backwards, which shifts the
measured balance of forces in a negative direction (3).
The average drag force Fd
over the stroke cycle was compared with the average boat speed v
for each of eight samples. It was found that the best fit equation is different
from the traditionally used: Fd= 2.59 v2.1726
(R2 = 0.989). In fact, the average Fd(F)
was found to be ~12% higher than Fd(v). This will be
further discussed in future publications.
Concluding: For the first time, the drag force on the
boat was determined directly with BioRow measurements, which can be used for evaluation of rowing technique and
equipment quality.
©2019 Dr. Valery Kleshnev www.biorow.com