


An analysis of the results of the 2018 World Rowing Championships
Breaking News
Five gold medals have been won by BioRow clients at the recent World Rowing Championships in Plovdiv, Bulgaria
- M1x NOR
- W1x IRL
- LM2x IRL
- LW1x FRA,
- LW4x CHN
Analysis of Plovdiv-2018 results
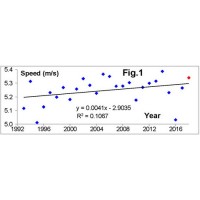
The weather conditions in Plovdiv were quite fast, so this was the fourth fastest World Championships regatta since 1992 (Fig.1), based on the average speed of the winners in the 13 events which were consistently in the Olympic program during this period (excluding LM4- and W4-). Only Amsterdam-2014, Gifu-2005 and Eton-2006 were faster.
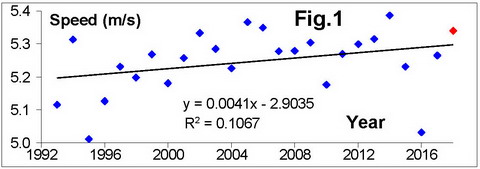
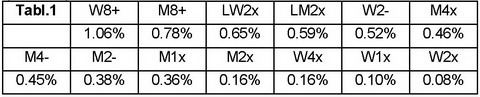
The general trend shows a growth of the winners’ speed at 0.41% per year. Similar to the previous years (RBN 2017/09), the highest growth of the speed was found in both eights and lightweight doubles, the slowest - in open sculling events (Tabl.1):
The average stroke rate in the 13 consistent Olympic boat types was 38.9spm – the same as in the previous Worlds in Sarasota (2017). This means the dramatic increase of the racing stroke rate found in 2017 appeared to be quite a persistent trend, so we can conclude that in recent times the winners of rowing events are rating ~2spm higher than in the past decade (Fig.2). The stroke rate was similar to 2017 in the men’s sweep categories, but decreased for lightweights (- 1.2spm); and slightly increased in other categories (0.2- 0.5spm higher than 2017).
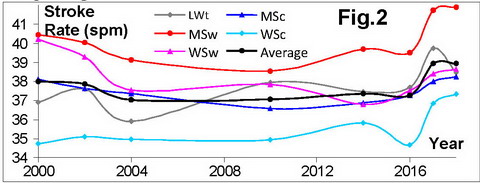
Table 2 shows the average stroke rates in the A finals of the Olympic events of the Worlds-2018. The average stroke rate of all the finalists was 0.5spm higher than in 2017. Interestingly, this average increase happened mainly because of the significant increase of the stroke rate in silver (+1.3spm) and bronze medal crews/scullers (+0.8spm), whilst other finalists had similar, or even lower stroke rates compared to 2017 (-0.2spm for winners). We can see from this that in 2018, the winners had similar stroke rates to 4th -6th place-takers, but silver and bronze medallists rated about 1spm higher.
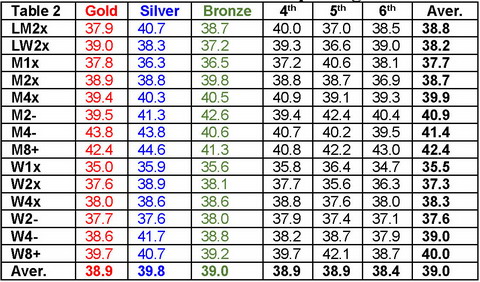
Fig.3 shows racing speed distribution (average in 14 Olympic events). The official GPS data was incorrect in one race (W2x LTU) and was corrected using stroke rate data and the EWpS model.
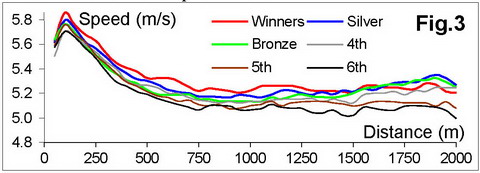
The winning crews were slightly faster at the start and significantly faster during the middle 1000m, but slower than the other medallists in the last 400m.
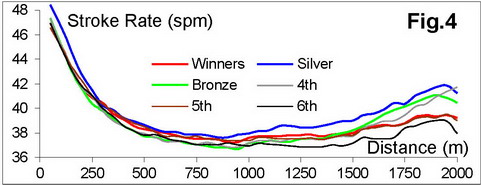
Fig.4 shows the distribution of the stroke rate, where silver medallists had the highest rate at the start and during the second half of the race; bronze medallists and fourth place-takers rated higher during the last 500m, but the winners did not show any outstanding stroke rates.
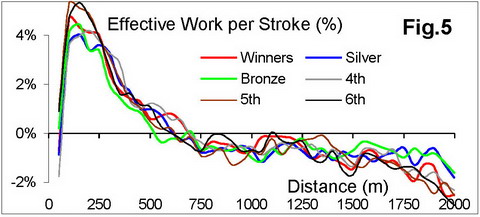
Analysis of EWpS (Fig.5) reveals significant “bursts” of effort from the winners after the 500m and 1000m marks, where they increased speed at the same stroke rate by means of a higher Work per Stroke.
©2018 Dr. Valery Kleshnev