


Practical implications of the blade analysis

Here we give some practical
conclusions based on the results of blade work analysis made in the previous
Newsletters. Nearly 200 variables were derived using previous definitions (RBN
2018/07) on a large data set measured with the BioRow system (n=28252, more
than 5 million numbers altogether), and all variables were tested for their
correlation with Blade Drag Factor DFbl and
blade efficiency Ebl. The Pearson
correlations were next ranked by strength. Starting with the strongest
correlations, the following practical conclusions can be made.
1.
Average normal blade velocity in the water (slippage) has the highest
correlations with both DFbl (r=-0.80)
and Ebl
(r=-0.82), which is quite a trivial conclusion: the faster the blade slippage in the water – the less efficient its
work.
2.
The drive time with positive blade slippage velocity was divided into
three equal periods, and the amount of wasted power was compared in each period:
Pw1
is the power wasted during the drive beginning, Pw2 – in the
middle, and Pw3 – at the end of the drive. We found that Pw1
had negative correlations with both DFbl (r=-0.57) and Ebl
(r=-0.26), but Pw3 had positive correlations with DFbl
(r=0.52) and Ebl (r=0.32). Interpretation: blade slippage during the beginning of the drive is the most harmful
for blade efficiency, while slippage at the end of the drive is the most
forgiving.
3.
To make the beginning of the drive efficient, the blade must be submersed into the water and force increased quickly
after the catch, which was confirmed by negative correlation of DFbl
with catch slip measured with vertical oar angle (r=-0.21, RBN 2009/10) and
force “slip” (r=-0.17, RBN 2017/03): the shorter the slips, the higher blade
efficiency. It is especially important to create a high force as early as
possible when the blade is slipping: high positive correlations of blade force
at this moment were found with both DFbl (r=0.42) and Ebl
(r=0.25).
4.
If force F and power P applied by a rower were analysed
similarly to Pw above, then emphasis on the middle of the drive F2
and P2
has both shown the highest negative correlation with DFbl (r=-0.35)
and Ebl
(r=-0.39). This means: a more even
distribution of a rower’s effort during the drive (i.e. more rectangular force
curve) helps to increase the blade efficiency. This was confirmed by
positive correlation of average/maximal force ratio with DFbl
(r=0.22).
5.
Surprisingly, a gearing ratio (actual outboard / inboard) had negative
correlations with both DFbl (r=-0.45)
and Ebl
(r=-0.06): the lighter the gearing - the higher the blade DF, which
contradicts our previous ideas and should be analysed further.
No significant correlations of
DFbl and Ebl
were found with the blade specific impulse (RBN 2013/11-12), Catch and
Rowing Style factors and amount of force and power applied by rower.
The above findings can be illustrated by a case study based on the data of a quad at 37.5 spm (Fig.1, Tab.1).
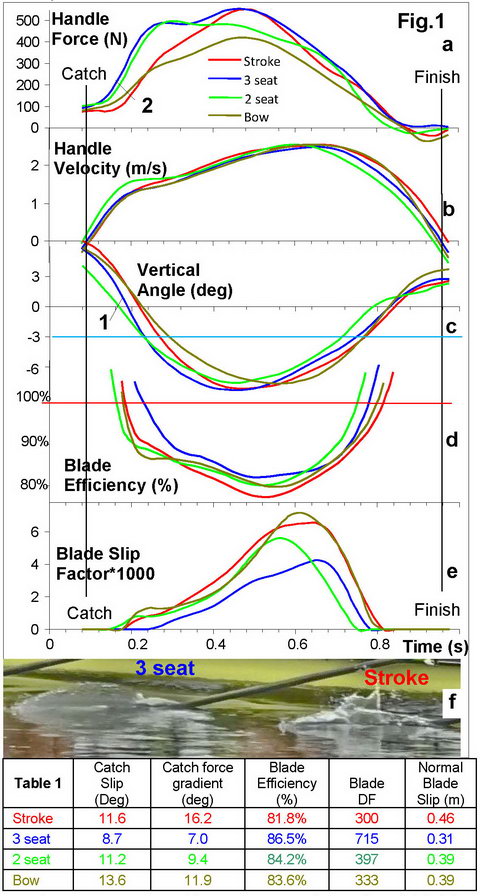
The seat 3 rower (the most
experienced and highly ranked one) inserts the blade into the water much
quicker than other crew members (1), which is accompanied with fast force
increase (2). Visually, the blade work of this rower looks like a solid, but
not high front splash (Fig.1.f), sort of wall of water in front of the blade.
The seat 3 rower had double the DFbl and a
blade slip distance 40% less (Table 1) then the stroke rower, who had longer
catch slip and slower force gradient. The
difference of 4.7% in the blade efficiency between the 3 seat and stroke rower equates
to 7s faster time in 2000m race.
©2018 Dr. Valery Kleshnev www.biorow.com