


Ergs comparison using BioRowTech system
Recently, the BioRowTech system (RBN 2017/08) was used for the comparison of rowing biomechanics on two types of ergometers: on the stationary Concept2 and on the RP3 with the floating stretcher mechanism.
On both machines, an international level rower (1.90m, 88kg) performed a test, consisting of eight 30s pieces with 2 min rest time, with stroke rate increasing from 20spm up to 40+ spm, and with racing force application. Positions of the handle, seat and shoulders were measured using string-pots from the BioRowTech system. The data was logged into a tablet PC, then processed using the BioRow averaging method (RBN 2017/12) and analysed in the BioRow Reports application.
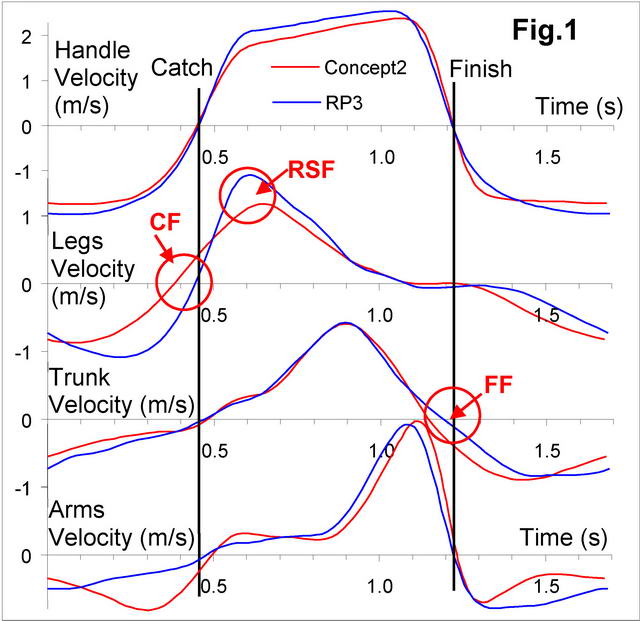
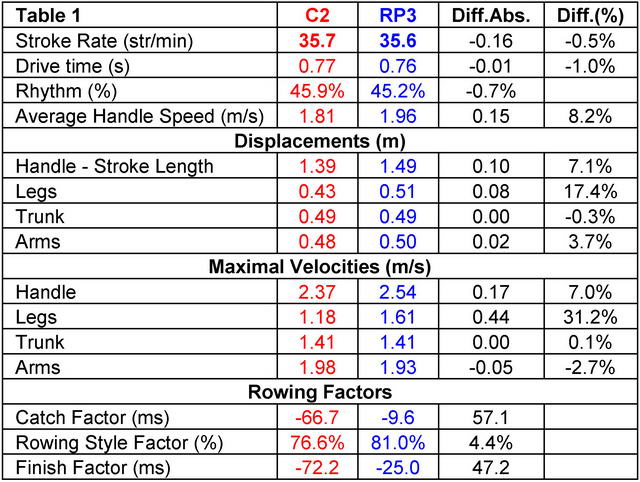
Fig.1 and Table 1 above presents a comparison of the data of the racing stroke rates (~35 spm), and reports on all data samples could be found here: BioRowTech Reports on Concept2; BioRowTech Reports on RP3. Though the stroke rates, drive times and rhythms were very similar on both machines, the stroke length was 10 cm (7.1%) longer on RP3. This happened mainly by means of a longer legs drive, which was 8 cm (17.4%) longer on the RP3, and slightly by means of arms (2 cm or 3.7% longer).
A longer stroke length for the same drive time indicates a higher velocity. The average handle velocity during the drive phase was 8.2% higher on RP3, and its peak velocity was 7.1% higher. The most significant difference was found in maximal legs velocity, which was 31.2% higher on RP3. Trunk velocities were identical, and the arms peak velocity was 2.7% lower on the RP3.
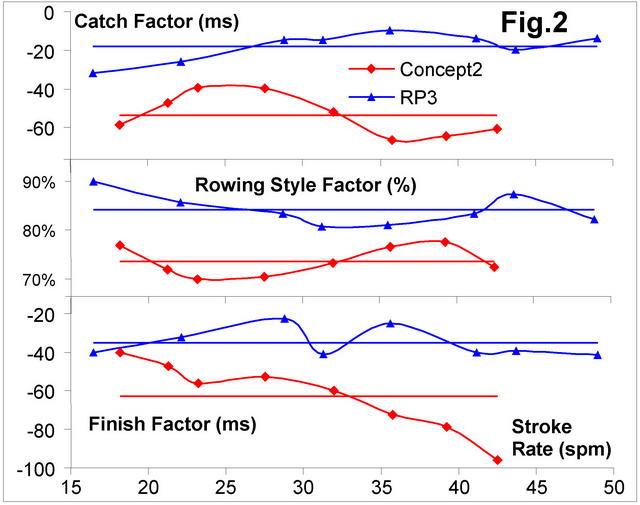
Fig.2 shows the Rowing Factors at various stroke rates. Catch Factor CF was more negative on C2 (-53 ms average over all stroke rates) than on RP3 (-18 ms). At low rates the difference were much smaller (-47 and -26 ms at 22-23 spm), but became more significant at higher rates (-67 and -10 ms at 35 spm, Tab.1), which happened mainly by means of a more positive CF on RP3. On stationary ergs, a more negative Catch Factor can be explained by higher inertia forces at the catch, which require more time for the acceleration of the rower’s mass, compared to a lighter flywheel on mobile erg.
Rowing Style Factor RSF was lower on C2 (73.6% averaged over all samples), compared to RP3 (84.2%), and this difference was more significant at lower rates, but less significant at racing rates (76.6% and 81% at 35 spm). This can be explained by the much faster legs velocity on the mobile erg, where power is applied at both the stretcher and the handle, whilst on the stationary erg, power is applied at the handle only.
At low rates, Finish Factor FF was practically the same on both machines at about -40ms. With the stroke rate increasing, FF became much more negative on the C2 (down to -95 ms at 42 spm), but remained at the same level on the RP3. This may be related to higher inertial forces on the stationary erg, but the mechanics of this are still not completely clear to us.
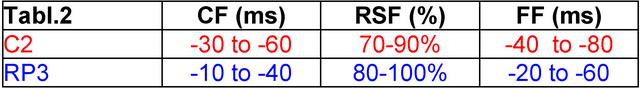
Concluding, as Rowing Factors appear to be quite different on stationary and mobile ergs, their targets ranges should be different as well (Tabl.2).
©2018 Dr. Valery Kleshnev www.biorow.com